Annual statistics
Smog days
A smog day is a day in which air emissions and weather conditions result in the formation of high concentrations of fine particulates and/or ozone over a large area, lasting many hours. The following three criteria are used to define and determine smog days:
- Intensity: The hourly concentration of fine particulates over a three-hour period of time must exceed 35 micrograms per cubic metre (µg/m3) or the concentration of ozone must exceed 82 parts per billion (ppb).
- Duration: The high concentrations (in excess of 35 µg/m3 for fine particulates or 82 ppb for ozone) must be observed for at least three hours.
- Dispersion: The high concentrations must be representative of the administrative region.
Number of fog days, by administrative region (2004–2022)
Administrative Region |
2004 | 2005 | 2006 | 2007 | 2008 | 2009 | 2010 | 2011 | 2012 | 2013 | 2014 | 2015 | 2016 | 2017 | 2018 | 2019 | 2020 | 2021 | 2022 |
|---|---|---|---|---|---|---|---|---|---|---|---|---|---|---|---|---|---|---|---|
| Abitibi-Témiscamingue | ND | ND | 2 | 7 | 0 | 1 | 3 | 2 | 2 | 1 | 1 | 0 | 0 | 0 | 2 | 2 | 1 | 8 | 1 |
| Bas-Saint-Laurent | ND | 4 | 2 | 3 | 0 | 0 | 2 | 0 | 0 | 2 | 0 | 1 | 0 | 0 | 1 | 0 | 0 | 1 | 0 |
| Capitale-Nationale | 15 | 21 | 10 | 6 | 2 | 3 | 9 | 2 | 12 | 11 | 8 | 11 | 3 | 1 | 9 | 5 | 19 | 15 | 11 |
| Centre-du-Québec | 8 | 14 | 7 | 8 | 2 | 3 | 6 | 3 | 6 | 5 | 0 | 3 | 0 | 1 | 0 | 2 | 5 | 7 | 1 |
| Chaudière-Appalaches | 5 | 11 | 4 | 4 | 0 | 1 | 0 | 0 | 0 | 2 | 0 | 0 | 0 | 0 | 0 | 0 | 1 | 4 | 0 |
| Estrie | 6 | 15 | 5 | 6 | 0 | 1 | 2 | 1 | 0 | 1 | 0 | 0 | 0 | 0 | 0 | 1 | 0 | 4 | 2 |
| Lanaudière | 10 | 22 | 5 | 8 | 8 | 19 | 13 | 17 | 13 | 7 | 1 | 11 | 1 | 8 | 7 | 2 | 10 | 6 | 7 |
| Laurentides | 9 | 15 | 1 | 5 | 1 | 1 | 4 | 0 | 0 | 3 | 1 | 0 | 0 | 0 | 0 | 0 | 0 | 3 | 0 |
| Laval | 21 | 34 | 10 | 13 | 10 | 29 | 18 | 14 | 18 | 6 | 5 | 9 | 7 | 7 | 9 | 5 | 9 | 4 | 4 |
| Mauricie | 11 | 19 | 4 | 5 | 3 | 12 | 6 | 5 | 7 | 7 | 0 | 5 | 6 | 5 | 2 | 6 | 9 | 4 | 4 |
| Montérégie | 16 | 28 | 7 | 7 | 5 | 11 | 8 | 8 | 14 | 7 | 7 | 7 | 1 | 3 | 3 | 0 | 6 | 6 | 1 |
| Montréal | 24 | 34 | 11 | 15 | 30 | 35 | 26 | 21 | 19 | 13 | 9 | 5 | 8 | 7 | 6 | 6 | 10 | 7 | 4 |
| Outaouais | 9 | 19 | 5 | 6 | 0 | 3 | 3 | 0 | 0 | 2 | 0 | 0 | 0 | 0 | 0 | 0 | 0 | 2 | 1 |
| Saguenay–Lac-Saint-Jean | 4 | 8 | 1 | 3 | 0 | 0 | 0 | 1 | 0 | 1 | 0 | 2 | 0 | 0 | 0 | 0 | 0 | 5 | 0 |
ND = no data
In 2022, the number of smog days by region varied between 0 and 11. The highest number of smog days was observed in the Capitale-Nationale region.
Average annual number of smog days (2004–2022)
Comparing 2022 data to previous years, the average number of smog days (2.6) dropped. Improved air dispersion conditions in winter and no major forest fires in summer explain the change.
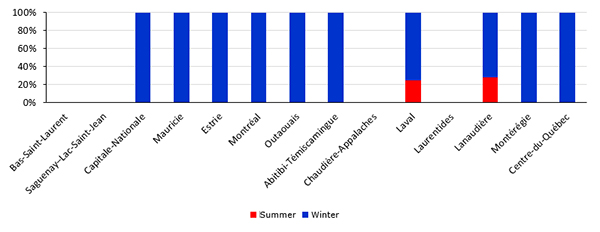
Ratio of number of smog days by period in 2022

As is the case each year, cold temperatures also had an impact on results in major urban areas due to residential wood heating. In fact, more than 90% of smog episodes occurred in winter (November–April).
The result for the Capitale-Nationale region is a good example of the impact of residential wood heating on air quality. All 11 smog days occurred in winter (November–April), consistent with the typical wood heating pattern. In addition, none of these episodes reached beyond the boundaries of Québec City itself, confirming their local origin.
Ozone has not been a smog day formation factor since 2017.
Learn more at Poor air quality statistics.
